
Find a past execution and its result
Move from the live canvas to durable run history, filter the list, and inspect the execution one step at a time.
1. Objective
Goal
Open Runs from the sidebar, locate a completed execution, and open its detail page. Read the Started, Finished, Duration, and Steps cards, then inspect the captured logs for the executed step.
Continue with studio-course, the manual first-workflow, and the first-job canvas saved by the preceding lesson. Do not create a parallel replacement project.
Prerequisites
- The top bar shows API online.
- The run started in the preceding lesson has reached a terminal state.
- The cumulative project and workflow are still available in Studio.
2. Steps
01Open run history
Objective
Move from the workflow editor to the history of executions saved by the API.
Actions
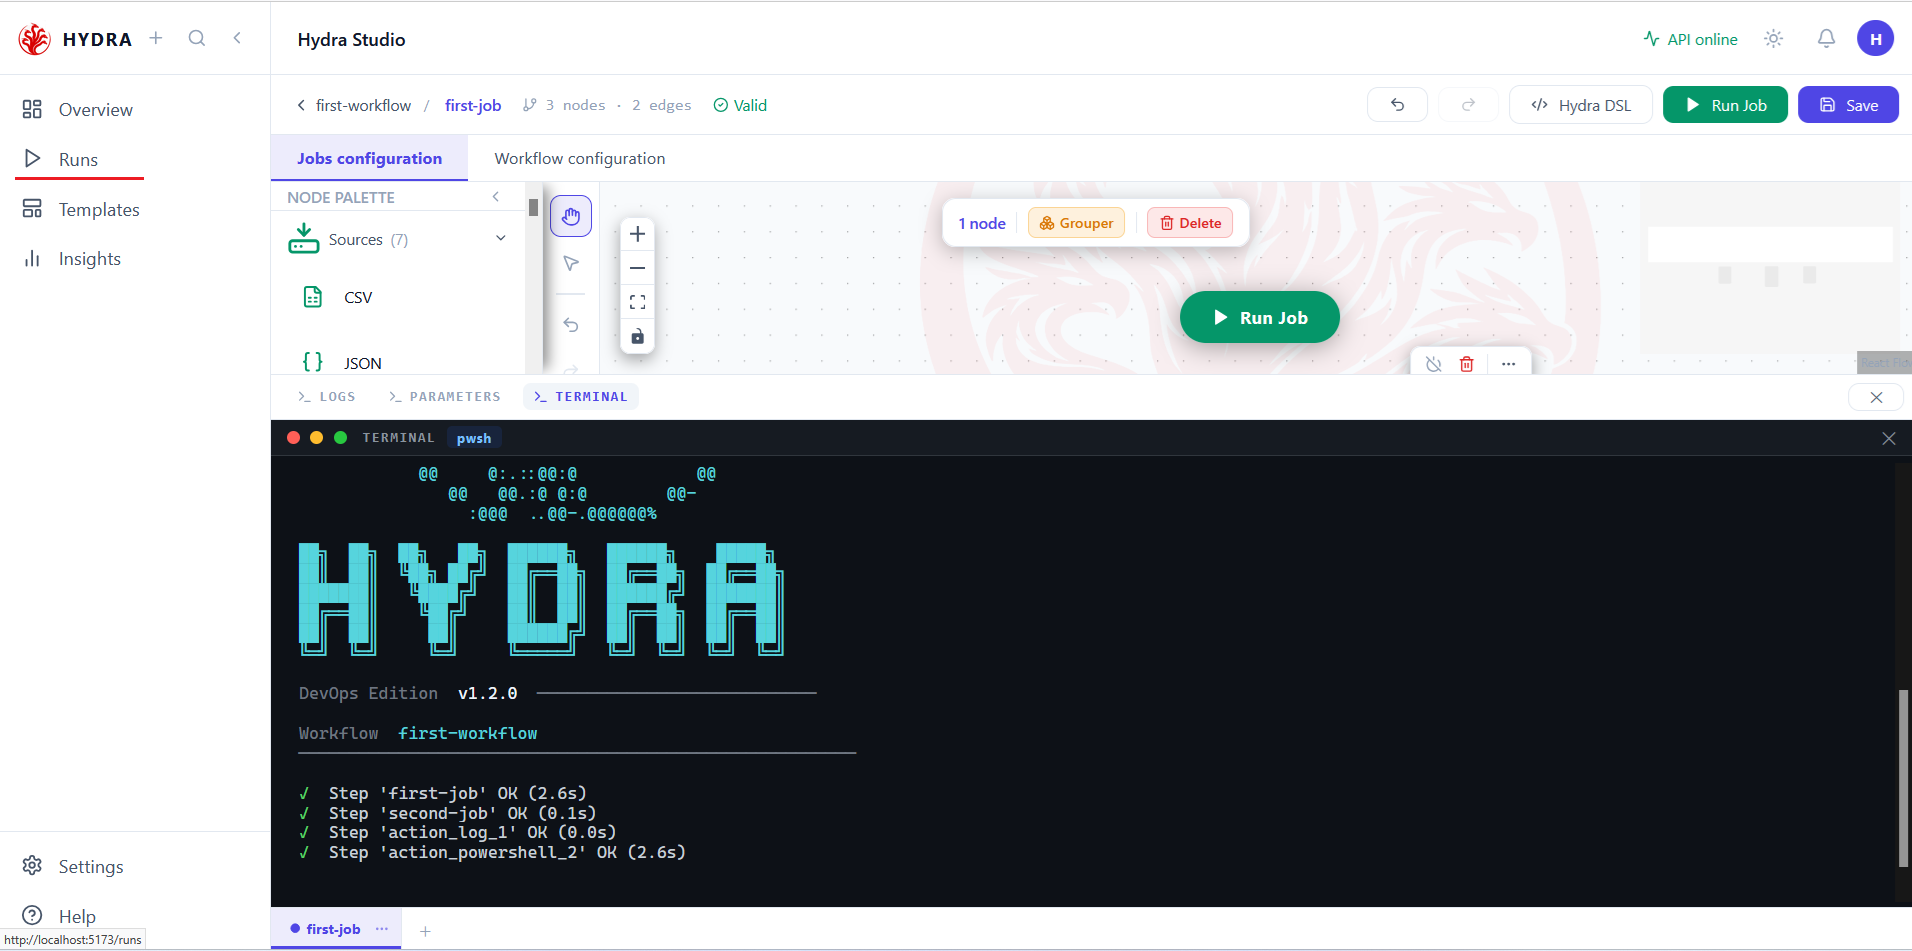
- Wait until the terminal state of the current run is visible.
- Find Runs in the left sidebar.
- Select Runs.
Sidebar → Runs
The Runs entry is available from the editor and opens the execution history without changing the saved canvas.
02Read the run history
Objective
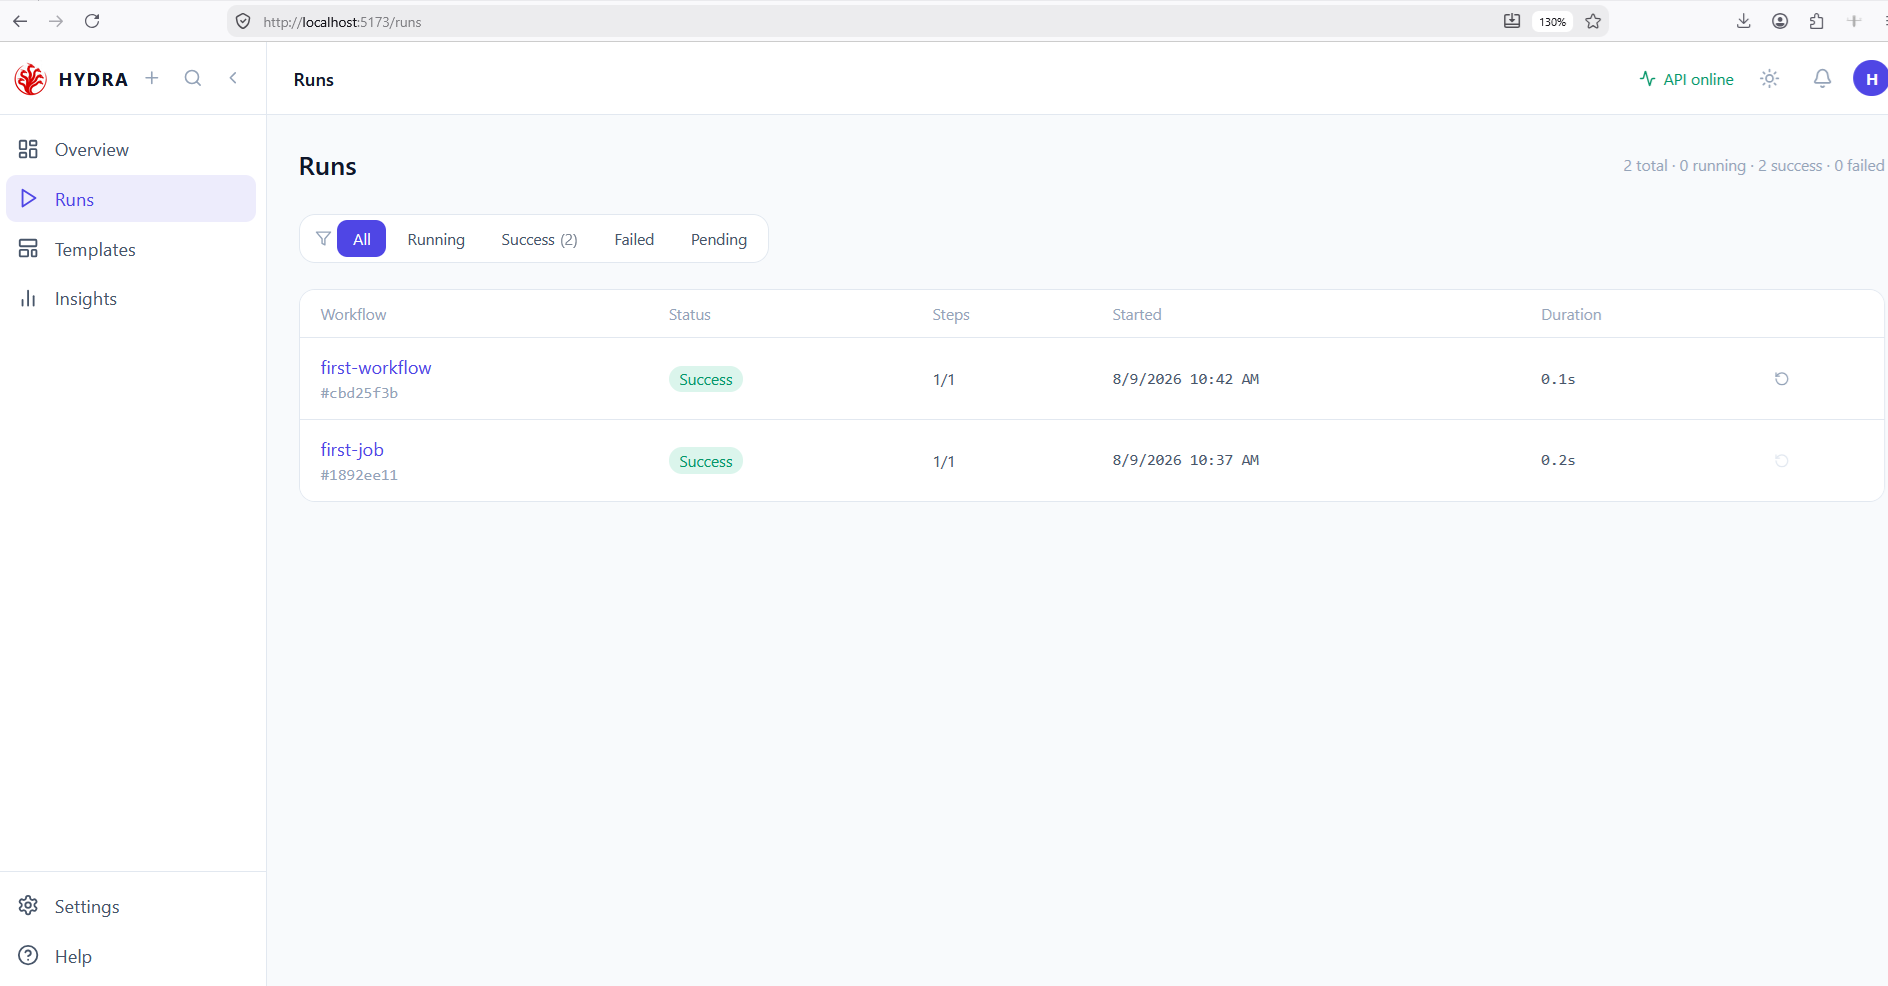
Identify the execution you want to review from its workflow, status, step count, start time, and duration.
Actions
- Read the totals in the upper-right corner.
- Use All, Running, Success, Failed, or Pending to narrow the list when needed.
- Find the successful
first-workflowrow created by the preceding lesson. - Select its workflow name to open the run.
Runs → Success → first-workflow
Each row exposes the workflow, short run identifier, status, completed steps, start time, and observed duration.
Workflow         Status    Steps    Started              Duration
first-workflow   Success   1/1      <observed time>      <observed>
03Inspect one execution
Objective
Connect the run-level result to the exact engine step and the rows it processed.
Actions
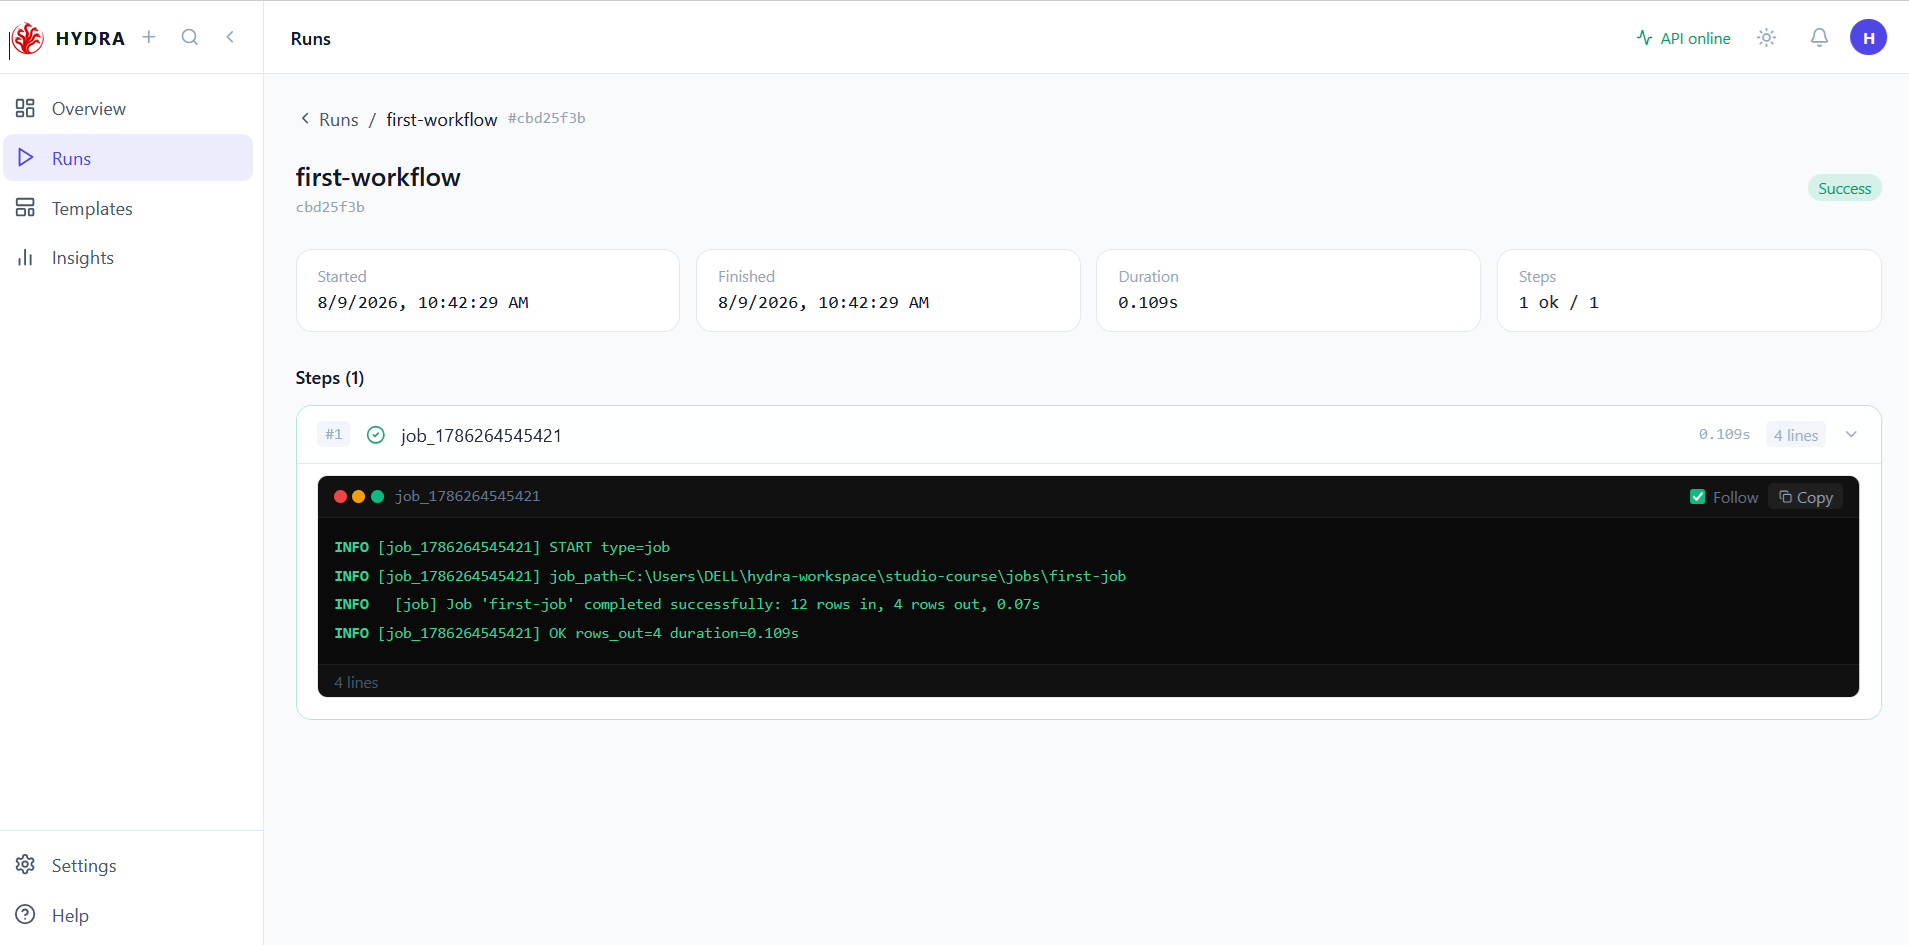
- Confirm the workflow name, short run identifier, and terminal status at the top of the page.
- Read Started, Finished, Duration, and Steps.
- Expand the step card if it is collapsed.
- Read the step status, duration, log count, job path, and row counters.
Run detail → Steps → job log
The run is successful, its single step is marked ok, and the log confirms that first-job wrote four rows.
Success
Steps: 1 ok / 1
Job 'first-job' completed successfully: 12 rows in, 4 rows out
OK rows_out=4 duration=<observed>
Tips and traps
Use the status filters when the history contains many executions.
A workflow name is not a unique run. Confirm the short identifier and start time before opening it.
Read the summary and the step log together: one describes the run, the other explains what executed.
Durations, timestamps, and run identifiers are observed values. They will not match the screenshots exactly.
The row counters are execution evidence: compare rows in with rows out to confirm the transformation result.
Do not confuse first-workflow with the earlier direct first-job run in the history.
3. Checklist
| Verification | Expected result |
|---|---|
| Runs page | Status filters and execution rows are visible |
| Selected entry | Matches first-workflow and shows Success |
| Summary cards | Started, Finished, Duration, and Steps are readable |
| Step detail | One successful step and its four log lines are visible |
| Row evidence | The log reports four rows written |
4. Troubleshooting
| Symptom | Cause | Fix |
|---|---|---|
| The run is still Running | Polling has not reached a terminal state | Wait and refresh the API-backed list |
| No run is listed | The job submission did not succeed or another workspace is active | Return to the editor and confirm the completed run |
| Logs are empty | The engine captured no lines for that step | Use status, duration, and output artifact as the remaining evidence |
5. Next lesson
You can now trace a job beyond the editor. The next lesson adds a second job tab, places both saved jobs on Workflow configuration, and connects them into an ordered dependency graph.